
In an ideal world, cricket historians and statisticians- and Roarers – would be able to quantify the effects of all the changes that batting has undergone since 1877, and reach consensus on which players most deserve to be considered all-time greats.
But unfortunately, none of us will ever agree on the exact meaningfulness of runs scored by different batters, at different times, in very different conditions.
Let alone the respective merits of being successful over a period, and scoring runs in live matches, away series or close wins. And playing for weak sides, or against strong opponents, on poor pitches, or without modern equipment. Every such measure necessarily involves a high level of subjectivity.
With that in mind I created a shortlist of arguably the most successful 200 batters in history, and ranked each player’s career figures according to 12 objective criteria. Every single run that each scored, contributed to his standings. No innings, match or series was disregarded.
The 12 criteria were- overall batting average; median score; frequency of being their side’s top-scorer; proportion of their teams’ total runs scored by them; frequency of centuries, half-centuries, scores over 25, and double-figure scores; and batting averages just for the instances when they scored centuries, half-centuries, 25 or more runs, and double-figures.
Had individual scoring rates been available for the entire history of Test cricket, I would have included it as well.
Unsurprisingly, most of the batters who ranked especially highly, are also considered among the best of all time when judged subjectively. But equally, some quiet achievers have been more successful than is generally given credit for.
It would be futile to attempt to rank hundreds of batters on raw figures alone. However, this exercise did reveal some interesting characteristics of individual players, which help explain why they are held in high regard.
To ensure reasonable sample sizes, I set a minimum qualification of 40 innings, for which 701 Test cricketers qualified. Sadly, that rendered ineligible a small number of genuinely-great players through no fault of their own.
In addition, the pre-WWI era’s generally-lower levels of run-making, counted heavily against its best batters.
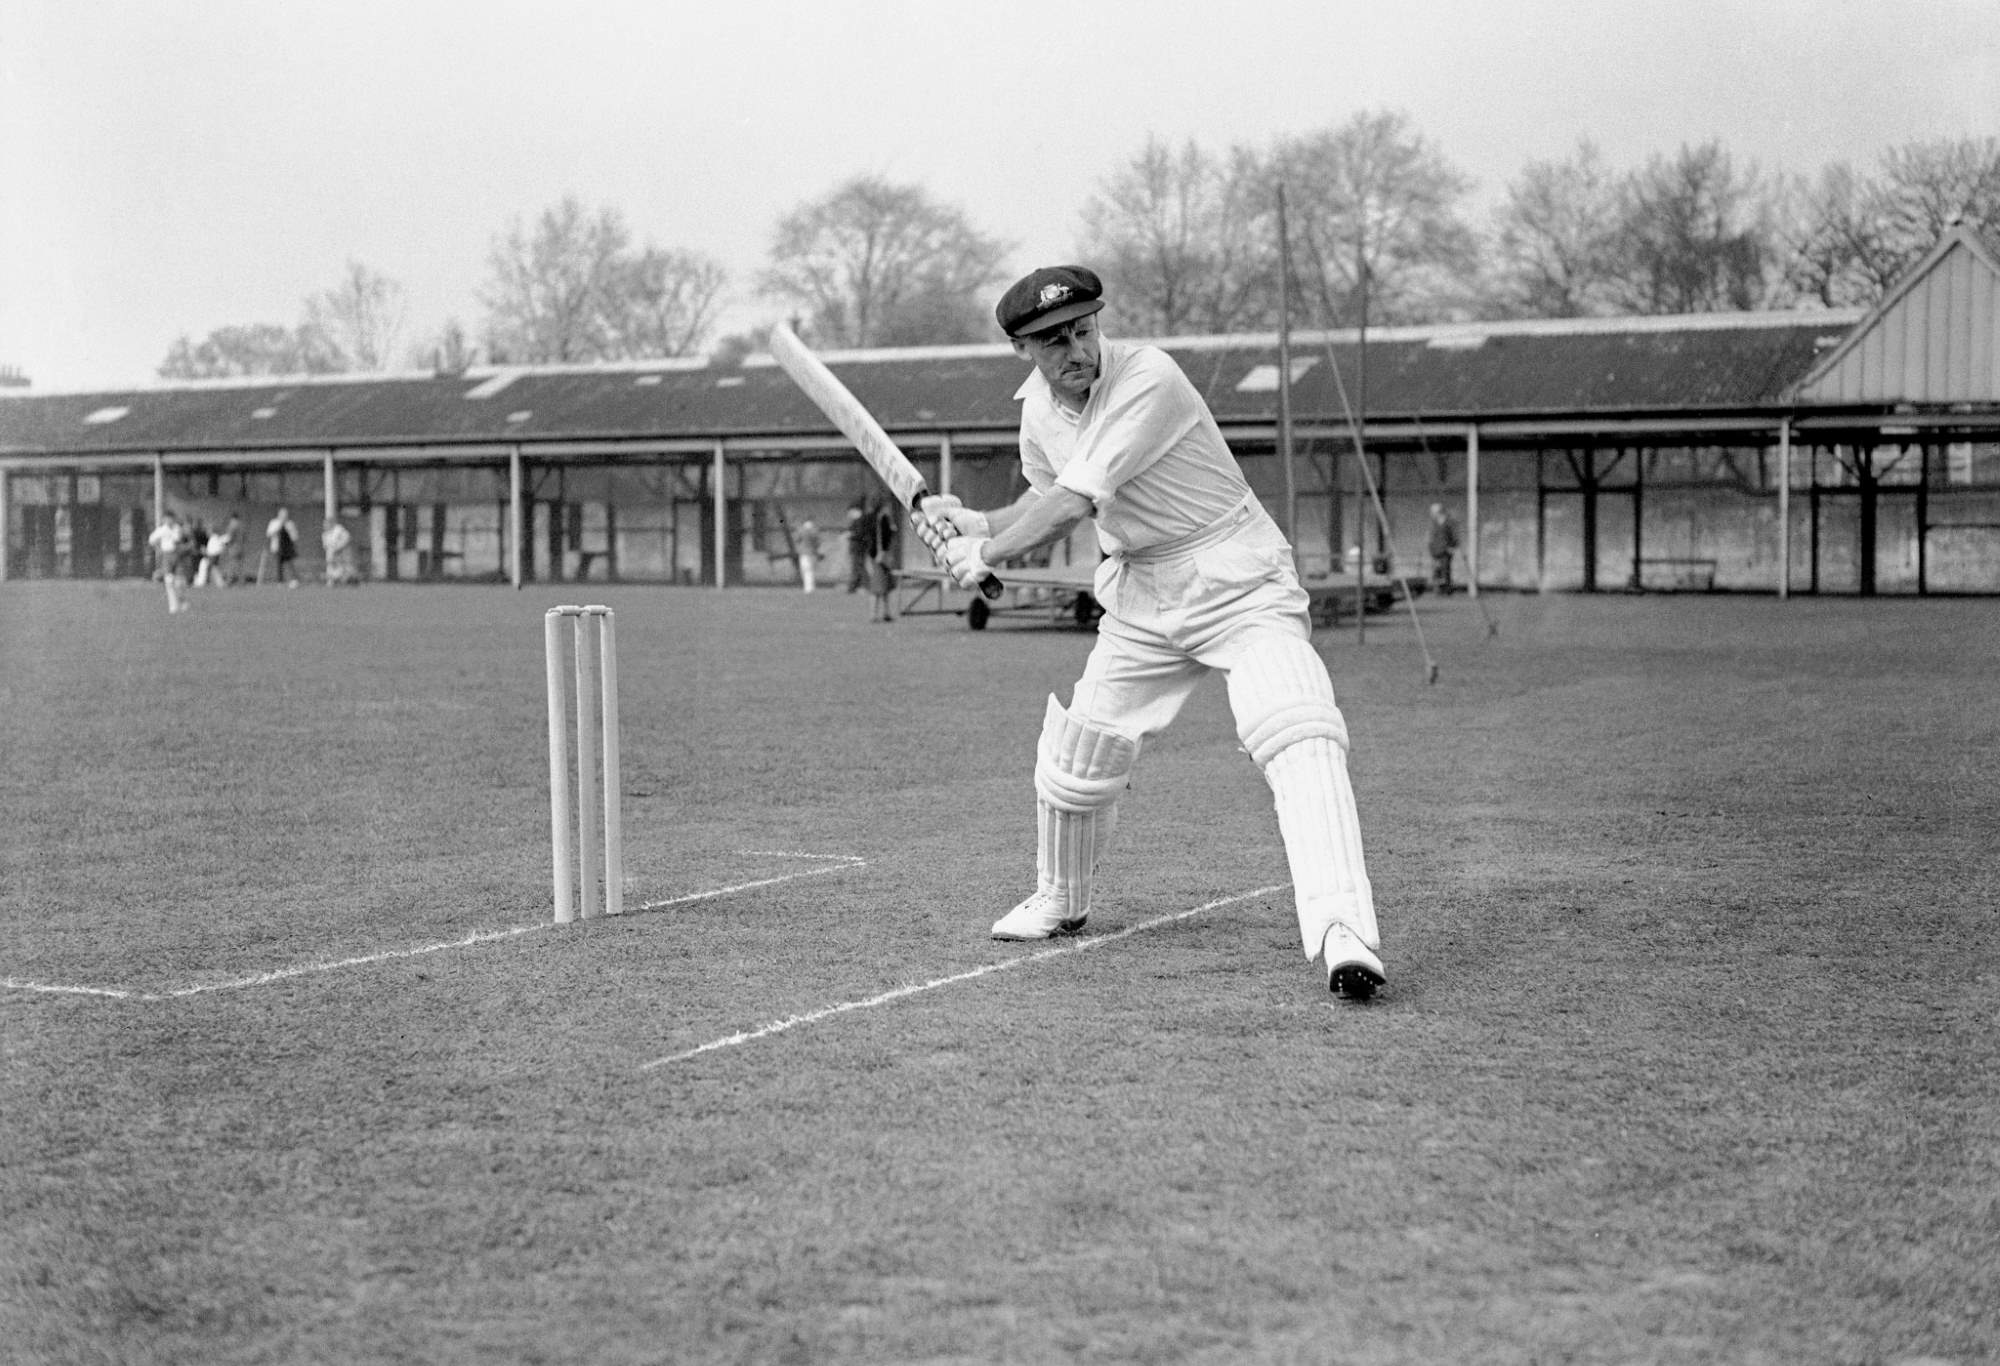
(Photo by S&G/PA Images via Getty Images)
The statistical outlier
It’s remarkable that the same batters claimed top position in nine of the 12 criteria.
Additionally, only the West Indies’ George Headley top-scored for a side more often, while only England’s Herbert Sutcliffe and Jack Hobbs reached double-figures more frequently. But that’s Don Bradman for you.
While Bradman recorded the highest batting average for any player’s innings of 50 runs and above, and also innings of 25 runs or more, his one lapse was his batting average for three-figure scores. 21 other players, headed by New Zealand’s Bert Sutcliffe with 367.50, surpassed Bradman’s figure of 234.47.
Which belies the claim that Bradman padded his overall average of 99.94 with red-inks and massive scores, any more than others have.
Could Brook become the finest batter since WWII?
When the current England vice-captain retires after probably another 10 years of Test cricket including three Ashes tours, his figures may exceed those of every other batter since Bradman.
His career is tracking that way, and his performances this Australian summer will provide an indication of his true ability.
Brook’s batting average of 57.55 is the ninth-highest on the list, despite him returning a solitary not-out from his 50 innings to date. His median score (the one that he reaches in half of his innings) is 36.5, a figure exceeded by only five other players. And he has been his side’s top-scorer in 26% of his innings, a figure bettered by only 15 other cricketers.
Only Bradman, Headley and fellow West Indian Clyde Walcott have bettered Brook’s scoring of a century in 20% of his innings, while only Bradman and Herbert Sutcliffe have bettered his 46% frequency of 50-plus scores. And just four other players have a higher batting average for their double-figure scores.
Interestingly more than 100 other batters have a higher batting average than Brook, for their three-figure scores. Should he increase the regularity of his ‘daddy’ hundreds and not-out innings, his overall figures will only improve. And finally, his scoring rate to date of 87.5 runs per 100 deliveries faced has been exceeded only by England’s Gilbert Jessop among players who have scored 500 or more runs.
While Sri Lanka’s PHKD Mendis has played only 24 innings to date, and so did not qualify for these rankings, his figures are also exceptional.
His batting average (62.66), median score (34.0), top-scoring frequency (29.17%), and frequency of hundreds (20.83%), half-centuries (41.67%) and double-figure scores (91.67%) are generally superior to those of Brook. Only time will tell whether he can maintain that level of performance over an entire career.

Harry Brook. (Photo by Mark Fletcher | MI News/NurPhoto via Getty Images)
Statistics can mislead
For a textbook example of how raw figures and small sample sizes can give false impressions, one need look no further than Adam Voges. No other player except Bradman has batted more than 24 times, and recorded an average higher than Voges’ one of 61.87.
Voges’ batting average was bolstered by being undefeated in seven of his 31 innings, a frequency of 23% and far higher than the typical 9%-11% for a top-order batter.
Additionally his average of 431.50 for his five centuries is higher than for any shortlisted player, as a result of three of them having been not-out, and scores of 269 not out and 239 being among them.
Underlining the fact that Voges found himself in the right place at the right time, is that his figures were far from unique. He was his side’s top-scorer in only four of his innings (12.90%, or approximately 1-in-8), while the typical frequency for a batter on this shortlist is 17%-19%.
And the batting averages for his teammates in the same 20 matches included 65.79 by Steve Smith, 62.46 by Usman Khawaja, 60.00 by Chris Rogers, 48.97 by David Warner, and 48.16 by Shaun Marsh.
Frequency of undefeated innings also influenced the career averages of other leading batters.
Australia’s Steve Waugh and the West Indies’ Shivnarine Chanderpaul (not out in 18% of their respective innings), and Australia’s Allan Border and Zimbabwe’s Andy Flower (both 17%), each averaged over 50.00 with higher-than-usual numbers of red-inks.
In contrast, Brook (2% of innings not-out, to date), the West Indies’ Brian Lara (3%) and India’s Yashasvi Jaiswal (4% to date) have maintained similarly-high averages despite their innings having been undefeated far less often.
Waugh claimed a top-10 position in three criteria- each player’s batting average for three-figure innings (with an average of 255.41), and innings of 50 or more runs (with 145.03), and scores of 25 or more runs (with 99.13).
Added to an unexceptional median score of 25.5, they suggest that once he got through the early stages of an innings, Waugh became more difficult to dismiss than any other batter in history except Bradman and Headley.
Headley is another all-time great whose record suggests vulnerability early in an innings, yet an exceptional ability to subsequently amass massive scores. His median score of 28.5 was exceeded by 62 other batters, and his frequency of double-figure scores by 32 others. Yet only Bradman bettered his 25% frequency in scoring 10 centuries from 40 innings.
And only Bradman and England’s Wally Hammond recorded higher batting averages for their innings of greater than 50 runs.
The greatest opening pair of all time?
England’s Hobbs and Sutcliffe are the most-successful first-wicket pair in Test history. Their 38 stands yielded 15 three-figure partnerships including ones of 283 and 268, and a further 10 stands in excess of 50 runs.
Their average partnership was 87.81 runs, a record for any duo that has opened more than five times. And their individual statistics further underline their value to their sides.
Hobbs claimed a top-five finish in six of the 12 criteria. In addition to reaching double-figures more often than any other batsman, his median score of 40.0 runs has been bettered only by Bradman and England’s Ken Barrington. And only three others top-scored for their team more often, or reached 25 runs in an innings more frequently.
Sutcliffe claimed a top-10 finish in eight of the 12 criteria. Only partner Hobbs reached double-figures more often, while only Bradman reached 50 runs and also 25 runs more frequently. And Sutcliffe’s career average of 60.73 was exceeded by only Bradman and – marginally- also by Headley (60.83) and South Africa’s Graeme Pollock (60.97).
Finally, an analysis of every shortlisted player’s median score unexpectedly revealed three opening batsmen whose reliability greatly assisted those who were to follow them to the crease. Australia’s Chris Rogers (38.5) was ranked fourth, and headed only by Bradman, Barrington and Hobbs.
He was closely followed by South Africa’s Eddie Barlow (in eighth place, with 35.0) and Australia’s Simon Katich (in 10th position, with 34.0). How Australia could use Rogers and Katich at the top of the order, this coming summer.
What might have been
Sadly, some exceptional players’ careers were interrupted or shortened by war, illness or apartheid. Had each been able to maintain their outstanding performances over a longer period, they would now be considered all-time greats.
The best example is South Africa’s Barry Richards, whose entire Test career lasted just seven weeks.
Of the shortlisted players, only Bradman surpassed Richards’ batting average of 72.57, or his 28.57% frequency of centuries with two in seven innings. A lowest score of 29 meant that he had a perfect 100% record in reaching double-figures, and then 25 runs, in an innings. And with two half-centuries in addition to his two tons, both his median score of 65.0, and his scoring of 50 or more runs in 57.14% of his innings, surpassed the record of every batter, including Bradman.
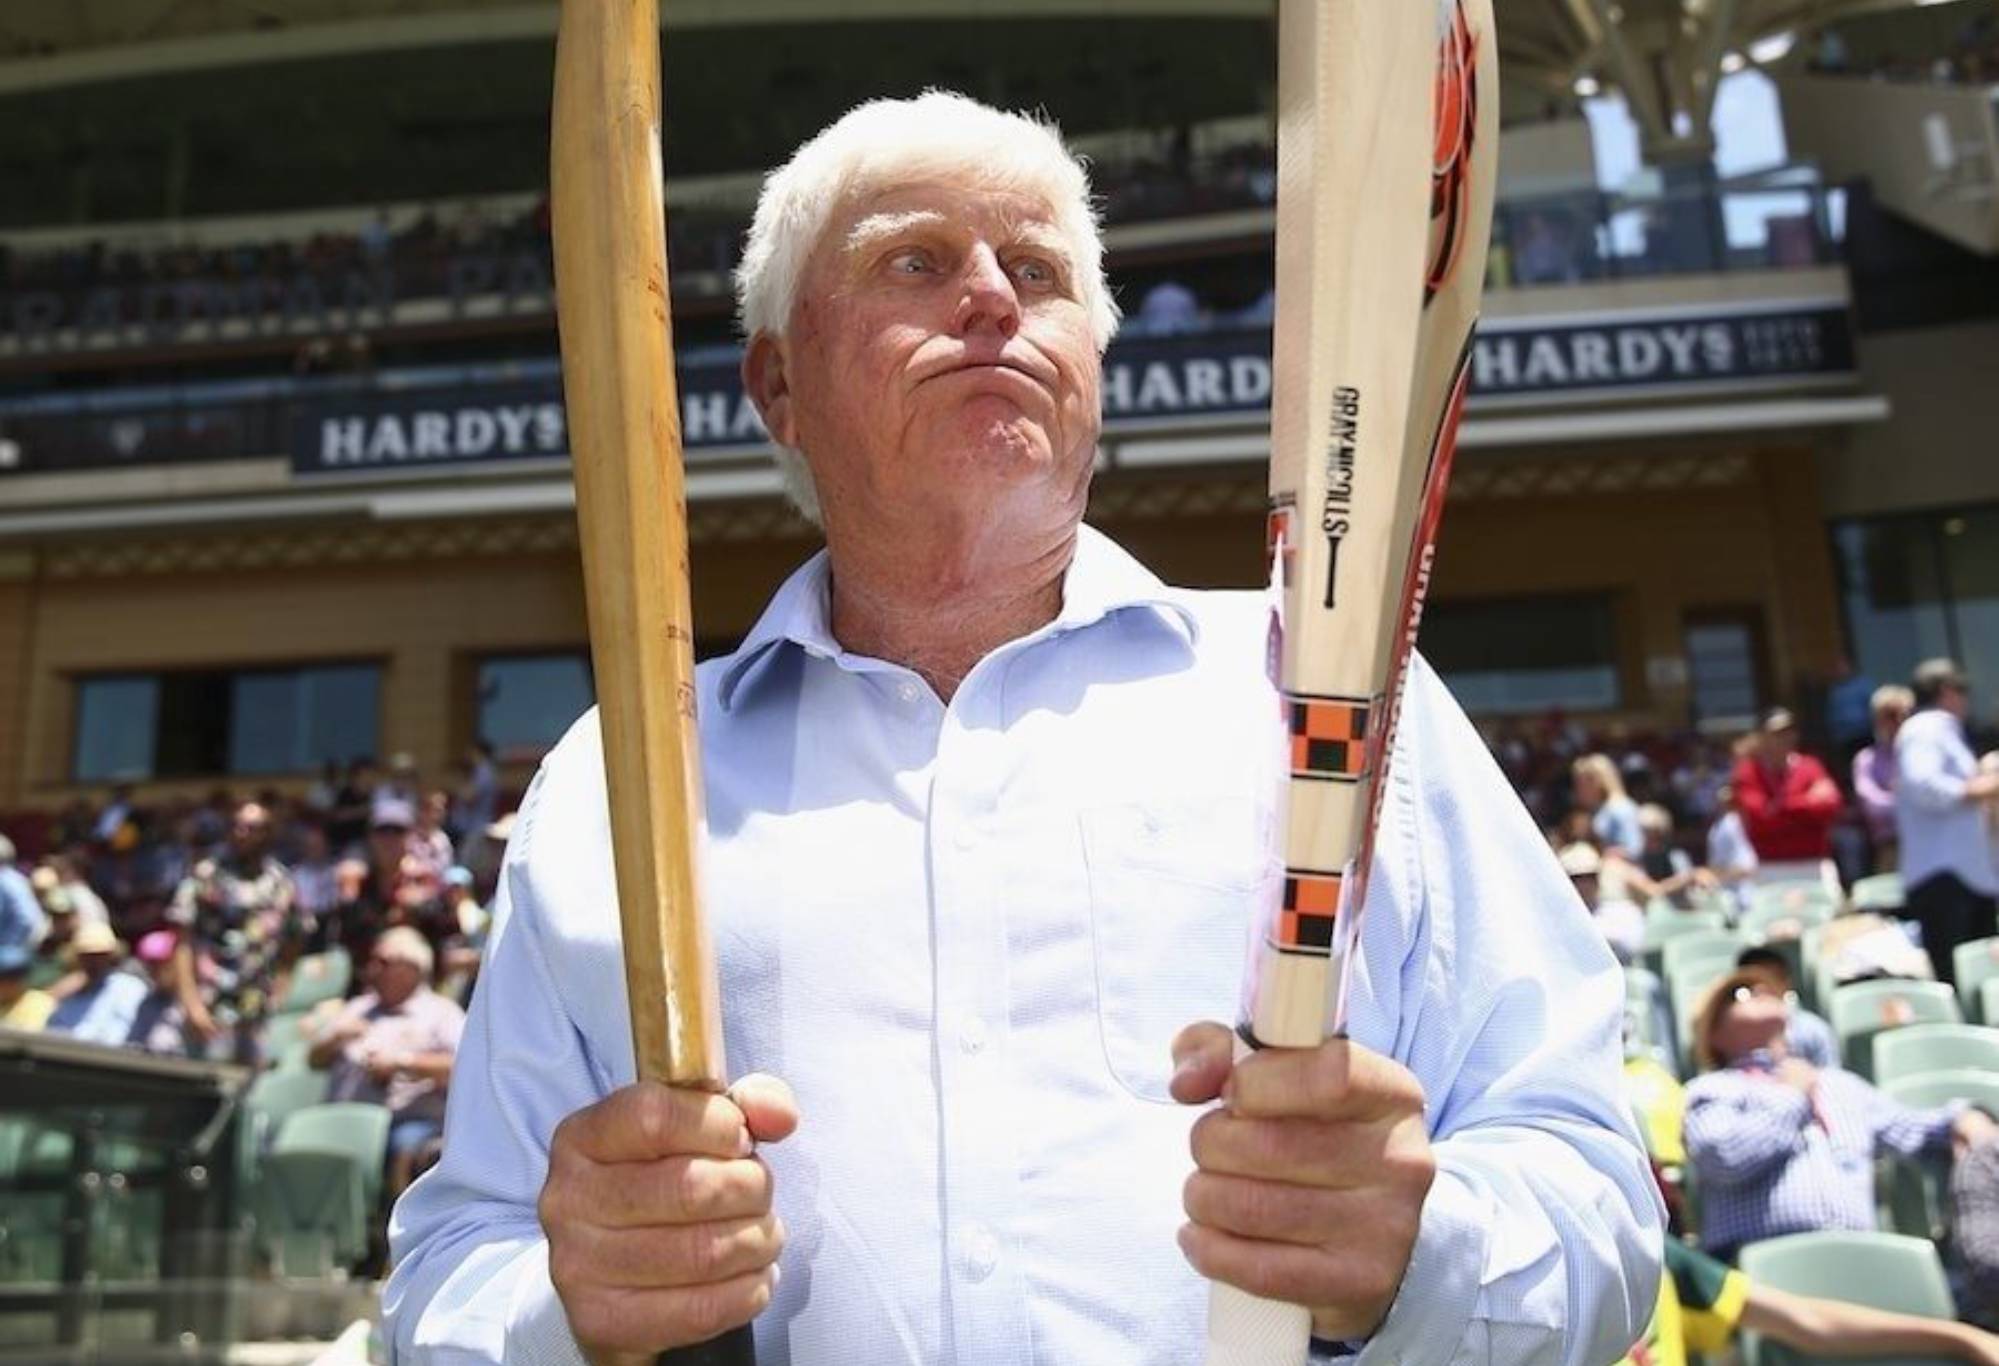
Kaboom: Barry Richards comparing his 1970 bat with David Warner’s Kaboom in 2015. (Photo: Cricket Australia)
The elegant Indian-turned-Englishman KS ‘Duleep’ Duleepsinhji, nephew of the legendary KS ‘Ranji’ Ranjitsinhji, was another who failed to realise his potential. Having scored 173 against Australia at Lord’s in 1930, he was forced to withdraw from the ‘Bodyline’ tour of 1932/33 due to illness.
He never played first-class cricket again, and later suffered a fatal heart attack aged only 54. His 19 innings for England yielded a batting average of 58.52. He also was his side’s top-scorer in 26.32% of his innings, and reached both double-figures and 25 runs more often than any shortlisted batters.
And his median score of 48.0 was higher than that of any shortlisted player except Bradman.
Statistical standouts whose careers were interrupted by WWII include Australia’s Sid Barnes (whose 19 innings returned a batting average of 63.06, and a median score of 41.0), New Zealand’s Martin Donnelly (who averaged 52.91 from 12 innings, and scored 206 at Lord’s in 1949) and South Africa’s Alan Melville (who scored four centuries in 19 innings, which yielded him a batting average of 52.59).
There’s more to greatness than statistics
As observed earlier, the best batters generally excel both objectively via pure figures, and subjectively as judged by experts.
In this exercise, the players who achieved the most top-10 placings across the 12 criteria were, in order- Bradman (11 times), Sutcliffe (eight), Pollock and the West Indies’ Everton Weekes and Headley (seven apiece), Hobbs and Barrington (6 each), Brook (five times), Walcott, and England’s Hammond and Len Hutton (each four), and Waugh, New Zealand’s Kane Williamson and Sri Lanka’s Kumar Sangakkara (three each).
Eagle-eyed Roarers may have noted the absence of Australia’s Steve Smith, India’s Sachin Tendulkar and the West Indies’ Brian Lara, Viv Richards and Garry Sobers from the above list of 14 batting greats. While each featured regularly in the 12 criterias’ top-20s, of them only Smith and Sobers (twice each) and Lara (once) were able to claim a top-10 position in any category.
Their absence underlines that greatness cannot be measured by raw statistics alone. If only we could agree, on which subjective measures to apply as well.
>Cricket News
%20(3).jpeg)


0 Comments