
Debates over the greatest cricketers of all time ultimately come down to personal opinion, filtered through legends, biases and direct experience. But statistics have to be part of the story.
There is no easy way to compare career numbers across different eras as other Roar articles have discussed.
Raw career averages are problematic when comparing individuals, especially for batting: playing conditions vary from era to era, as do the strength and range of opponents.
One angle I haven’t seen explored is the ICC ratings which were developed in the 1980s by English stats guru Rob Eastaway with support and input from former England captain Ted Dexter.
They were launched as the Deloitte ratings, later bore other brand names, and are now owned by the ICC itself. As well as rating current players and teams, they can also be applied retrospectively to find the batting or bowling rating at any point in time for all Test players since 1877 (and for ODIs and T20Is).
Unfortunately, the ICC keeps the complex algorithm driving the ratings under wraps as commercial IP, so we can’t scrutinise its assumptions.
But they do claim to take account of factors that often aren’t reflected in individual scores or raw averages, notably:
– quality of the opposition bowling or batting.
– match context runs made in critical situations or under pressure are rated more highly.
– overall scoring conditions in the match: runs in low-scoring matches may get weighted higher.
– the match result: if the player was among the top scorers or wicket-takers and the team wins, bonus points are awarded, particularly against strong opponents.
Thus Brian Lara’s magnificent 153 not out steering the West Indies to a one-wicket victory against a strong Australian attack in 1999 boosted his rating by a similar factor as his record-breaking 400 vs England in 2004, in a draw.
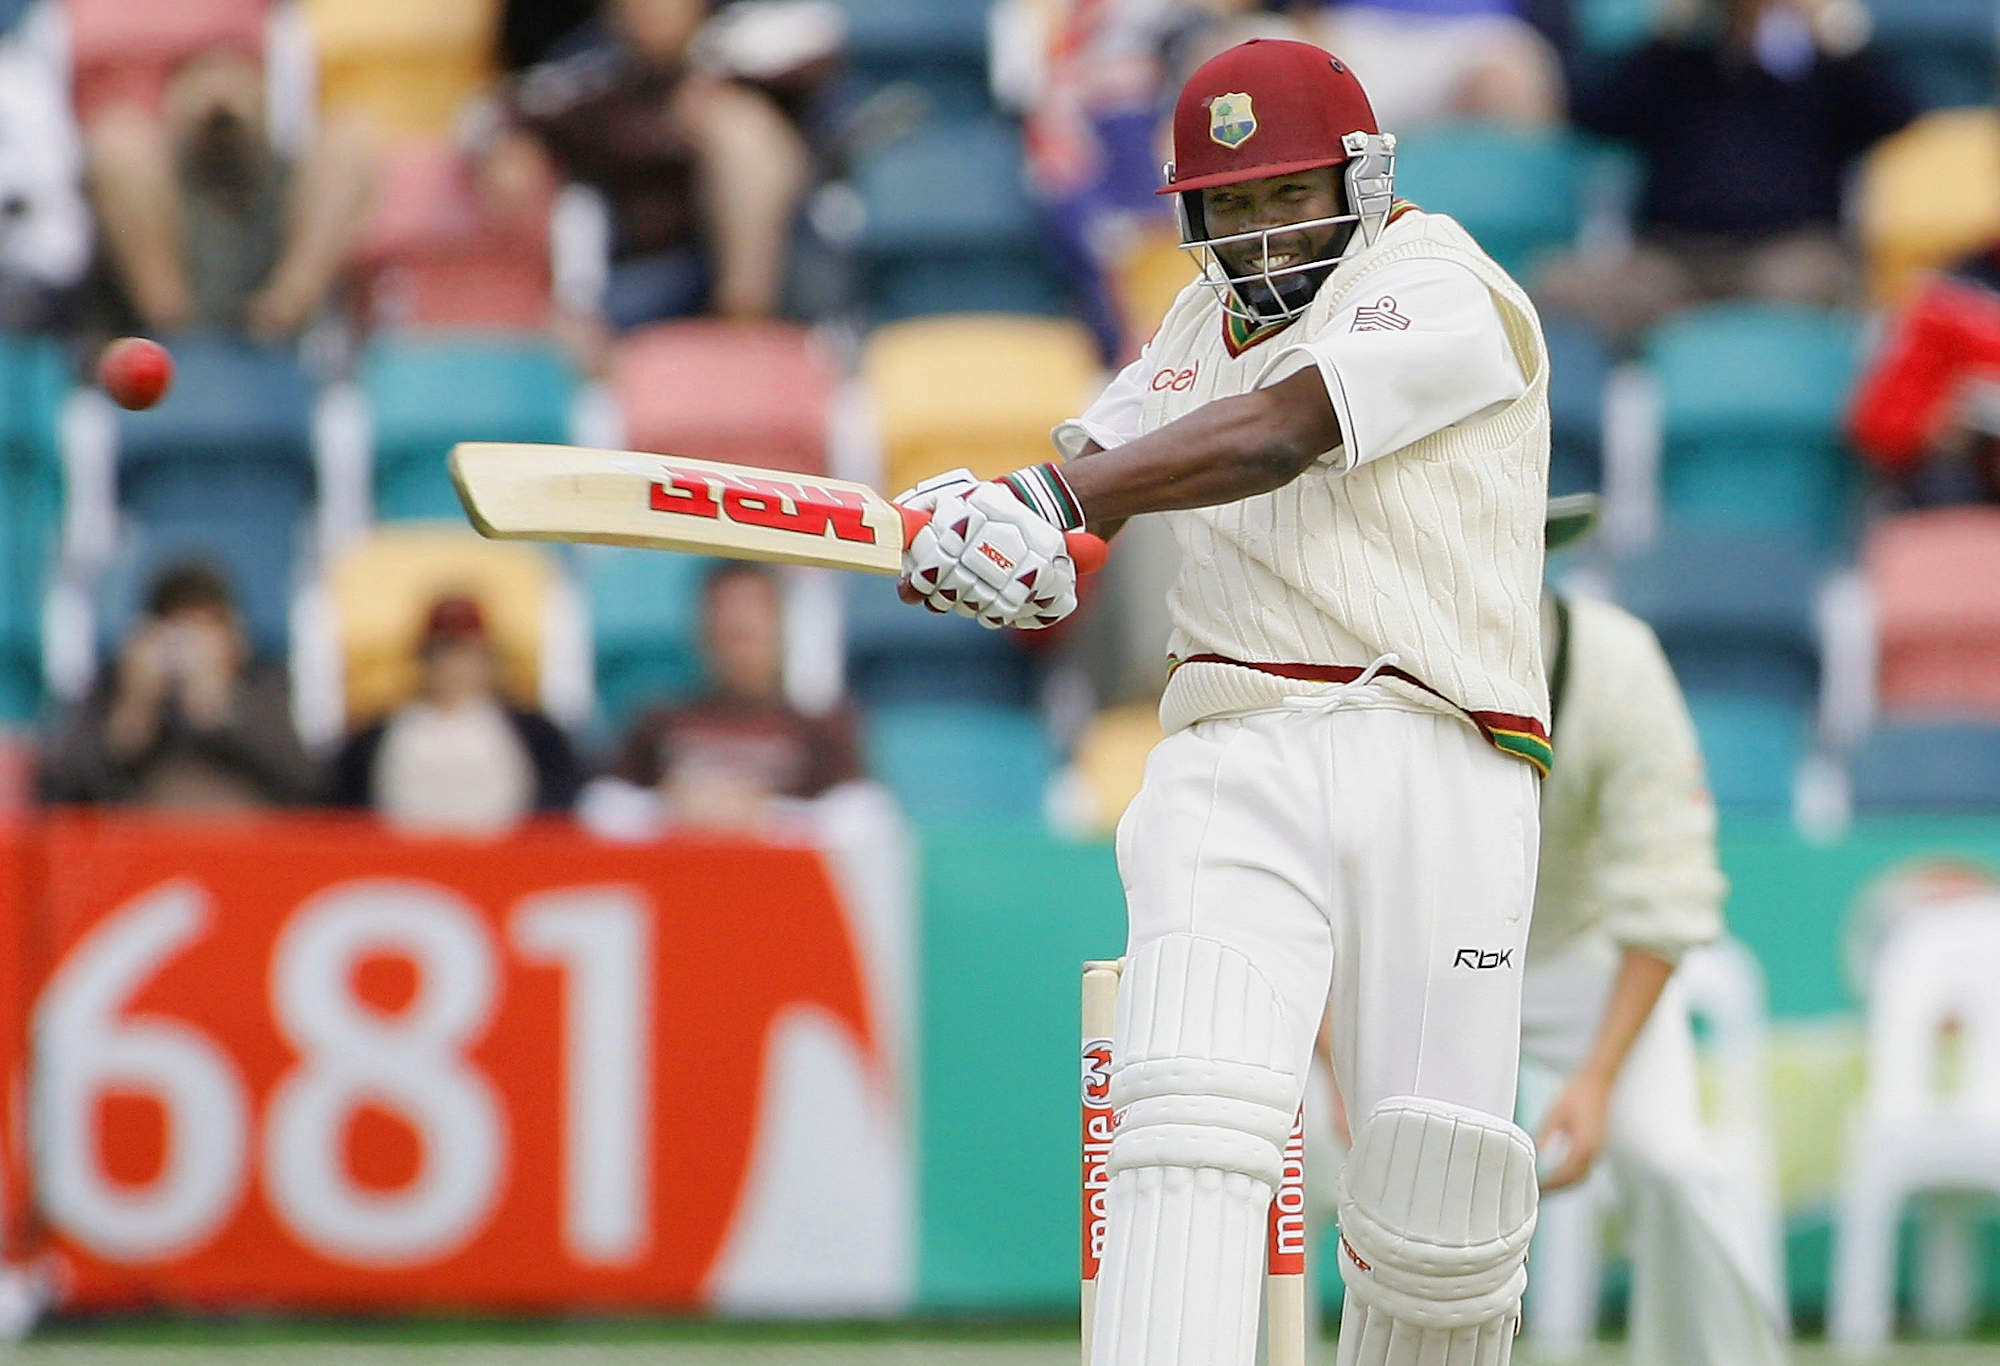
West Indian legend Brian Lara in action. (Photo by Hamish Blair/Getty Images)
I decided to see which Test batters achieved the highest average ICC ratings over an extended period – namely peaks of 10 or seven consecutive playing years. I calculated these numbers for 40 batters who are often touted as great, were among the best of their day, or achieved very high career averages.
I gave greatest weight to a best consecutive 10-year span because virtually all the great batters have had careers at least that long. The average career for those examined was 14 years.
Also, given how the ICC ratings work, it can take players up to four years to get good ratings even if they score lots of runs from the get-go.
The rating at any individual time covers performance over the previous four years, with greater weight given to the most recent. For example, Steve Smith sat on a very meagre 377 rating (best ever is 961) for two years while he was out of the team in 2011-13.
A 10-year peak also makes sense as Test batters often have a stuttering start (like Smith) before finding their feet, or sometimes go a bit downhill at the very end (e.g. Viv Richards). But I also calculated seven-year peaks, giving them a slightly lower weighting (70%). This is fairer to a few players like Len Hutton and Herbert Sutcliffe, whose careers only lasted a bit over 10 consecutive playing years.
To get the average ratings, I extracted (with some computing help) individual batters’ ratings every two months over their careers – on the first of January and then bi-monthly.
Ratings almost never fluctuate enough between two-month intervals to affect the long-term average significantly. The best consecutive 10 and seven years of ratings (excluding gaps for the World Wars) were weighted as explained above to produce a composite score and ranking.

Steve Smith. (Photo by Robert Cianflone/Getty Images)
The table below lists the batters with the top 20 composite score. It also shows their average rating and rank for their best 10 years; their rank for seven-year average ratings; their average rank across 10 years; and their actual career batting averages.
It has two big asterisks. In the 1970s, World Series Cricket threw the ratings out of kilter for two very highly rated batsmen – Richards and Greg Chappell. Both had very good records in WSC Supertests against most of the best bowlers in the world, but their ICC ratings stagnated or declined simply because they weren’t in official Test teams.
Chappell had the added disadvantage that his big scores for Australia vs a Rest of the World team in 1971-72 didn’t count. So I have taken the liberty of estimating where their ratings might have gone if those unofficial Tests had been included.
ICC All-Time Batting Ratings
| Rank | Player | 10y Ave Rating (Period) | 7y Rank | Avg Rank (10 y) Career Avg | |
| 1 | Don Bradman | 1. 923 (1931-1948) | 1 | 1.0 | 100 |
| 2 | Garry Sobers | 2. 903 (1959-1969) | 3 | 1.3 | 58 |
| 3 | Steve Smith | 3. 885 (2015-2024) | 2 | 2.4 | 56 |
| 4 | Jack Hobbs | 4. 883 (1912-1928) | 5 | 1.2 | 57 |
| 5 | Viv Richards* | 5. 863 (1976-1986) | 4 | 1.7 | 50 |
| 6 | Kane Williamson | 6. 860 (2016-2025) | 10 | 2.8 | 55 |
| 7 | Kumar Sangakkara | 7. 850 (2005-2015) | 7 | 4.1 | 57 |
| 8 | Len Hutton | 12. 834 (1939-1955) | 6 | 3.1 | 57 |
| 9 | George Headley | 9. 842 (1934-1952) | 9 | 2.7 | 61 |
| 10 | Ricky Ponting | 15. 824 (2000-2009) | 8 | 6.0 | 52 |
| 11 | Brian Lara | 10. 838 (1995-2005) | 13 | 3.0 | 53 |
| 12 | Greg Chappell* | 11. 836 (1974-1984) | 12 | 3.1 | 54 |
| 13 | Joe Root | 8. 843 (2015-2025) | 20 | 3.5 | 51 |
| 14 | Neil Harvey | 13. 826 (1951-1961) | 16 | 3.7 | 48 |
| 15 | Jacques Kallis | 14. 825 (2003-2012) | 25 | 5.4 | 55 |
| 16 | Sachin Tendulkar | 16. 817 (1994-2004) | 15 | 3.4 | 54 |
| 17 | Virat Kohli | 18. 803 (2015-2024) | 18 | 7.4 | 47 |
| 18 | Herbert Sutcliffe | 17. 808 (1925-1935) | 23 | 2.0 | 61 |
| 19 | Shivnarine Chanderpaul | 20. 801 (2005-2015) | 21 | 7.3 | 51 |
| 20 | Steve Waugh | 24. 796 (1994-2004) | 17 | 5.6 | 51 |
*Ratings for Richards and Chappell adjusted to reflect World Series Cricket and Rest of the World unofficial Tests.
Bradman, Sobers, Hobbs, Richards and Hutton would be in many pundits’ best all-time lists. Fewer might have Steve Smith so clearly in the top four.
Williamson is the biggest surprise – perhaps because he flies under the radar as a Kiwi? The fact he only averages under 40 away from home against Australia, England, India and South Africa makes me suspect that the ratings suffer from not giving extra weight to away scores, which I understand is the case.
But it’s been tougher away from home over the last decade due to shortened tours with few lead-up games.
Kumar Sangakkara doesn’t get mentioned often in conversations about the best all-time, maybe because – like Williamson – we didn’t notice.
But during his 10-year peak he averaged 60 with 22 centuries against the top bowling attacks (i.e. excluding Bangladesh, West Indies and Zimbabwe).
For Tendulkar to fall outside the top 10 might be blasphemy in India. But his stature rests mainly on sheer longevity over 200 Tests and huge aggregate runs, as well as a great ODI career.

Kumar Sangakkara. (Photo by Quinn Rooney/Getty Images)
Drilling down into his career we find some less stellar periods. And his career average drops under 50 if we take out the 41 Tests he played against Bangladesh, Zimbabwe and Sri Lanka.
These average ratings produce a very different pecking order than raw career averages. Some batters with very high career averages, like Jacques Kallis and Sutcliffe, fall outside the top 10, with Wally Hammond (22nd), Everton Weekes (24th), Clyde Walcott (27th) and Ken Barrington (31st) even further down.
This certainly fits with the question marks raised over some players for feasting on weaker attacks or in less pressured situations. Like Tendulkar, Kallis’s career batting average drops below 50 if we take out 26 matches against Zimbabwe, Bangladesh and the weak post-2000 West Indies.
Among other big names, AB de Villiers, Hashim Amla, Rahul Dravid and Allan Border sit just outside the top 20, in places 21-26.
For added context, the highest ever individual ratings recorded are: 1. Bradman 2. Smith 3. Hutton 4.= Hobbs and Ponting 6. Peter May 7.= Sobers, Richards, Sangakkara and Walcott. The gap between Bradman’s (961) and Smith’s (947) peak ratings is greater than the gap between Smith and the four on equal seventh (938).
The leaders in terms of the number of times each player held No.1 ranking over the 60 bi-monthly intervals across their best 10 years were Bradman (57), Sobers and Hobbs (49), Richards (39), Hutton (27) and Smith (24).
A couple of players would rank much higher if we just used 10-year average ratings alone (e.g. Joe Root). But overall the placings wouldn’t change much if we altered the span or the weightings.
Sir Donald Bradman. (PA Images via Getty Images)
The differences between Smith and Hobbs or Williamson and Sangakkara aren’t really significant. Likewise Ricky Ponting, Lara, Chappell and Root are grouped very close together. Of course, the final career ratings for Smith, Williamson and Root could change by the time they retire.
So do these results give extra insight when comparing the greats? Or do issues like treating home away scores the same raise doubts about the ratings algorithm?
I should add that this may not be a perfect application of the ICC ratings. For starters, the rating on any single date is based on innings over the previous four years, not individual scores.
Also, the ratings don’t go up in simple arithmetic progression: a big innings will give you more of a boost on a lower rating than on a higher one. That’s why Bradman’s ratings don’t seem that much higher than the next best. The ratings have a ceiling of 1,000 and to reach it you’d have to average near 1,000 over a sustained period!
Despite such doubts, these average ICC ratings paint a pretty credible picture – it’s not the only answer, but useful evidence in the overall debate.
I would be happy with an all-time top six line-up of Hobbs, Hutton (2nd opener), Bradman, Smith, Richards and Sobers.
What the ratings say about the greatest bowlers must wait for a future article.
>Cricket News
%20(3).jpeg)


0 Comments